World Food Day 2022: India Tops Hunger Charts in South Asia
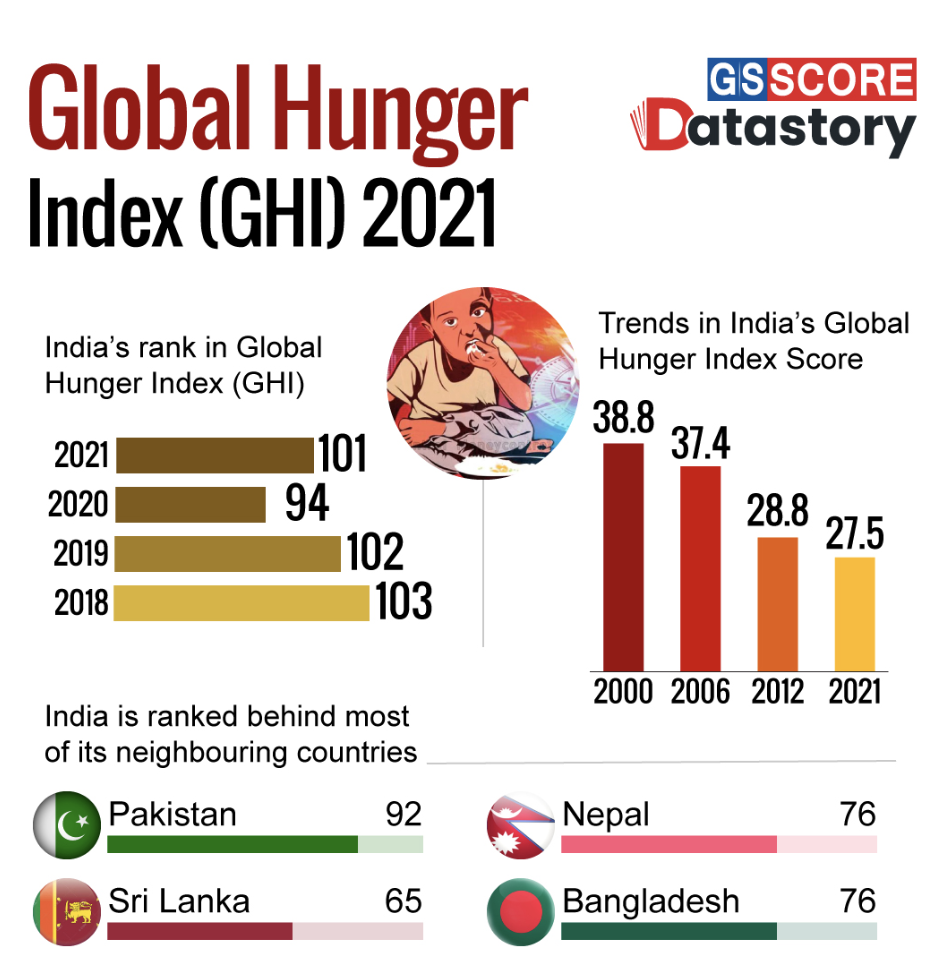
India ranks 107th for hunger among 121 nations. The nation fares worse than all of its South Asian neighbors except for war-torn Afghanistan ranked 109, according to the Global Hunger Index 2022. Sri Lanka ranks 64, Nepal 81, Bangladesh 84 and Pakistan 99. India and Pakistan have levels of hunger that are considered serious. Both have slipped on the hunger charts from 2021 when India was ranked 101 and Pakistan 92. Seventeen countries, including Bosnia, China, Kuwait, Turkey and UAE, are collectively ranked between 1 and 17 for having a score of less than five.
 |
| South Asia Hunger Rankings. Source: GHI/IASScore |
India’s child wasting rate (low weight for height), at 19.3%, is worse than the levels recorded in 2014 (15.1%) and even 2000 (17.15), and is the highest for any country in the world and drives up the region’s average owing to India’s large population, according to The Hindu newspaper. The child hunger situation has gotten worse since Mr. Narendra Modi was elected Prime Minister of India in 2014. Earlier this year, Prime Minister Modi offered to "feed the world" in the aftermath of the Ukraine war. Within weeks of this pledge he ended making an about-face. On World Food Day 2022, the United Nations World Food Program has warned of another year of global record hunger looms amid food and climate crisis.
 |
| India Hunger Trends. Source: GHI |
 |
| Pakistan Hunger Trends. Source: GHI |
Pakistan has a score of 26.1 and ranks 99th out of the 121 countries on Global Hunger Index rankings. India's GHI score is 29.1 and it ranks 107th. Hunger could worsen in Pakistan in the aftermath of the worst-ever flooding that has destroyed wheat and rice crops in southern Sindh province. Flood waters have not yet drained from the fields and standing water is preventing planting of the Rabi (winter) crop now. Here's an excerpt of USDA Food and Grain report on the wheat situation in Sindh:
"Farmers normally begin planting the wheat crop in mid-October and November in Sindh and Punjab, respectively. Sindh province usually accounts for almost twenty percent of national wheat production. However, large areas of Sindh typically planted to wheat are still submerged, and it may be several months before the flood waters recede. With Sindh’s flat terrain, poor drainage, and current high-water table, flood waters are receding slowly. As a result, seeding the 2023/24 wheat crop in Sindh is likely to be delayed and some areas may possibly remain unseeded. Even where the waters recede, farmers are likely to face difficulties in wheat planting as the floods washed away on-farm wheat seed stock in many areas. Additionally, farmers’ purchasing power in the affected areas is severely compromised making it difficult for them to buy fertilizers and other inputs".
The number of hungry people around the world has shot up from 282 million to around 345 million since the beginning of 2022, and by mid-year, according to the United Nations World Food Program. “We are facing an unprecedented global food crisis and all signs suggest we have not yet seen the worst”, said WFP Executive Director David Beasley. “For the last three years hunger numbers have repeatedly hit new peaks. Let me be clear: things can and will get worse unless there is a large scale and coordinated effort to address the root causes of this crisis. We cannot have another year of record hunger”.
Related Links:
Haq's Musings
South Asia Investor Review
Pakistan Among World's Largest Food Producers
Food in Pakistan 2nd Cheapest in the World
India in Crisis: Unemployment and Hunger Persist After COVID
Impact of Russia Sanctions on Food, Fuel Availability
Record Number of Indians Seeking Asylum in US
Vast Majority of Pakistanis Support Imran Khan's Handling of Covid19 Crisis
Incomes of Poorest Pakistanis Growing Faster Than Their Richest Counterparts
Pakistanis Consuming More Calories, Fruits & Vegetables Per Capita
How Grim is Pakistan's Social Sector Progress?
Pakistan Fares Marginally Better Than India On Disease Burdens
COVID Lockdown Decimates India's Middle Class
Pakistan Child Health Indicators
Pakistan's Balance of Payments Crisis
How Has India Built Large Forex Reserves Despite Perennial Trade Deficits
Riaz Haq's Youtube Channel


Comments
@the_hindu
Just in | Government again rejects Global Hunger Index which ranks #India 107 among 121 countries, says it is "an erroneous measure of hunger and suffers from serious methodological issues." |
@jagritichandra
reports.
https://twitter.com/the_hindu/status/1581283026495229952?s=20&t=vhOF6t1n5El-8AYKivbd0A
https://www.globalhungerindex.org/pakistan.html
In the 2022 Global Hunger Index, India ranks 107th out of the 121 countries with sufficient data to calculate 2022 GHI scores. With a score of 29.1, India has a level of hunger that is serious.
https://www.globalhungerindex.org/india.html
-------------------
India also ranks below Sri Lanka (64), Nepal (81), Bangladesh (84), and Pakistan (99). Afghanistan (109) is the only country in South Asia that performs worse than India on the index.
https://www.thehindu.com/news/national/india-ranks-107-out-of-121-countries-on-global-hunger-index/article66010797.ece
India ranks 107th among 121 countries on the Global Hunger Index, in which it fares worse than all countries in South Asia barring war-torn Afghanistan.
The Global Hunger Index (GHI) is a tool for comprehensively measuring and tracking hunger at global, regional, and national levels. GHI scores are based on the values of four component indicators — undernourishment, child stunting, child wasting and child mortality. Countries are divided into five categories of hunger on the basis of their score, which are ‘low’, ‘moderate’, ‘serious’, ‘alarming’ and ‘extremely alarming’.
Based on the values of the four indicators, a GHI score is calculated on a 100-point scale reflecting the severity of hunger, where zero is the best score (no hunger) and 100 is the worst.
India’s score of 29.1 places it in the ‘serious’ category. India also ranks below Sri Lanka (64), Nepal (81), Bangladesh (84), and Pakistan (99). Afghanistan (109) is the only country in South Asia that performs worse than India on the index.
Seventeen countries, including China, are collectively ranked between 1 and 17 for having a score of less than five.
India’s child wasting rate (low weight for height), at 19.3%, is worse than the levels recorded in 2014 (15.1%) and even 2000 (17.15), and is the highest for any country in the world and drives up the region’s average owing to India’s large population.
Prevalence of undernourishment, which is a measure of the proportion of the population facing chronic deficiency of dietary energy intake, has also risen in the country from 14.6% in 2018-2020 to 16.3% in 2019-2021. This translates into 224.3 million people in India considered undernourished.
But India has shown improvement in child stunting, which has declined from 38.7% to 35.5% between 2014 and 2022, as well as child mortality which has also dropped from 4.6% to 3.3% in the same comparative period. On the whole, India has shown a slight worsening with its GHI score increasing from 28.2 in 2014 to 29.1 in 2022. Though the GHI is an annual report, the rankings are not comparable across different years. The GHI score for 2022 can only be compared with scores for 2000, 2007 and 2014..
Globally, progress against hunger has largely stagnated in recent years. The 2022 GHI score for the world is considered “moderate”, but at 18.2 in 2022 is only a slight improvement from 19.1 in 2014. This is due to overlapping crises such as conflict, climate change, the economic fallout of the COVID-19 pandemic as well as the Ukraine war, which has increased global food, fuel and fertiliser prices and is expected to "worsen hunger in 2023 and beyond."
The prevalence of undernourishment, one of the four indicators, shows that the share of people who lack regular access to sufficient calories is increasing and that 828 million people were undernourished globally in 2021.
There are 44 countries that currently have “serious” or “alarming” hunger levels and “without a major shift, neither the world as a whole nor approximately 46 countries are projected to achieve even low hunger as measured by the GHI by 2030,” notes the report.
https://hdr.undp.org/system/files/documents/hdp-document/2022mpireportenpdf.pdf
https://hdr.undp.org/sites/default/files/publications/additional-files/2022-10/2022_mpi_statistical_data_table_1_and_2_en.xlsx
India has forged ahead of PAK, BD in reducing multidimensional poverty as per the latest release by UNDP OPHI MPI for 2022.
For India the score is 0.069 (16% headcount, 42% extent of deprivation) ahead of NEP 0.074 (17.5%, 42%), BD 0.104 (24.6%, 42%), PAK 0.198 (38.3%, 52%). SL still remains tops in South Asia with a score of 0.011.
Lower the score, better it is.
The title of the UNDP paper is "Unpacking Deprivation Bundle". Below is an excerpt from it:
"The analysis first looks at the most common deprivation profiles across 111 developing countries (figure 1). The most common profile, affecting 3.9 percent of poor people, includes deprivations in exactly four indicators: nutrition, cooking fuel, sanitation and housing.7 More than 45.5 million poor people are deprived in only these four indicators.8 Of those people, 34.4 million live in India, 2.1 million in Bangladesh and 1.9 million in Pakistan—making this a predominantly South Asian profile "
https://hdr.undp.org/system/files/documents/hdp-document/2022mpireportenpdf.pdf
Also note in this UNDP report that the income poverty (people living on $1.90 or less per day) in Pakistan is 3.6% while it is 22.5% in India and 14.3% in Bangladesh.
Living standards (Cooking fuel Sanitation Drinking water Electricity Housing Assets) of the poor in Pakistan (31.1%) are better than in Bangladesh (45.1%) and India (38.5%).
Pakistan fares worse in terms of education (41.3%) indicators relative to Bangladesh (37.6%) and India (28.2%).
In terms of health, Pakistan ( 27.6%) fares better than India (32.2%) but worse than Bangladesh (17.3%).
In terms of population vulnerable to poverty, Pakistan (12.9%) does better than Bangladesh (18.2%) and India (18.7%)
Here is another way to look at it:
31.1+41.3+27.6 = 100%
For instance, if you go to Sheet 2, you realise that 31% of PAK doesnt have access to clean cooking fuel, only 13% Indians dont. Now the fun part- only 11% Indians dont have access to sanitation, 21% of Pak doesnt.
So how do you explain the following?
"The analysis first looks at the most common deprivation profiles across 111 developing countries (figure 1). The most common profile, affecting 3.9 percent of poor people, includes deprivations in exactly four indicators: nutrition, cooking fuel, sanitation and housing.7 More than 45.5 million poor people are deprived in only these four indicators.8 Of those people, 34.4 million live in India, 2.1 million in Bangladesh and 1.9 million in Pakistan—making this a predominantly South Asian profile "
https://hdr.undp.org/system/files/documents/hdp-document/2022mpireportenpdf.pdf
Also note in this UNDP report that the income poverty (people living on $1.90 or less per day) in Pakistan is 3.6% while it is 22.5% in India and 14.3% in Bangladesh.
https://ophi.org.uk/multidimensional-poverty-index/mpi-faqs/
What does the MPI measure?
The MPI identifies overlapping deprivations at the household level across the same three dimensions as the Human Development Index (living standards, health, and education). It shows the incidence of poor people in a population and the intensity of deprivations with which poor households contend. For details see Alkire and Santos 2010, 2014. Read more about the MPI methodology here.
What makes a household “multidimensionally” poor?
One deprivation alone may not represent poverty. The MPI requires a household to be deprived in multiple indicators at the same time. A person is multidimensionally poor if he or she is deprived in at least one third of the weighted indicators (see below for definitions of ‘severe’ poverty and ‘vulnerable’ to poverty).
Why is income not included?
We could not include income due to data constraints. Income poverty data come from different surveys, and these surveys often do not have information on health and nutrition. For most countries we are not able to identify whether the same people are income poor and also deprived in all the MPI indicators. Therefore, we could not include income.
How was the MPI created?
The MPI was created by Alkire and Santos and other researchers at OPHI, who applied a new technique developed by Sabina Alkire and James Foster to over 100 developing countries. Read more about the Alkire Foster method for multidimensional measurement.
The MPI is described as a measure of acute poverty. How does this differ from extreme poverty?
The MPI reflects the severe deprivations that people face at the same time. Because it was designed to compare acute poverty across developing nations, it is most relevant to less developed countries. We have described the MPI as a measure of ‘acute’ poverty to avoid confusion with the World Bank’s measure of ‘extreme’ poverty that captures those living on less than $1.90 a day.
------------------
What are the new thresholds for each indicator?
The new threshold for nutrition includes BMI (Body Mass Index)-for-age, and stunting as well as underweight for children. For child mortality, it considers whether a child has, sadly, perished in the household in the last five years preceding the interview date. For years of schooling, the new threshold requires six years, rather than five years, of schooling. A household is deprived in the housing indicator if the floor is made of natural materials; or the roof or walls are made of natural or rudimentary materials. Finally, the assets indicator now includes ownership of computers and animal carts. More info here.
Why was the original MPI modified?
The global MPI was originally created in 2010 and much has changed in the past eight years! Most notably, the new global MPI takes into consideration the Sustainable Development Goals, which were agreed upon in 2015. The new version also builds on an innovative MPI, trialed since 2014, and newly available data to include cut-offs that were not possible in 2010.
The World Bank says the national poverty rate in Pakistan could increase by 2.5 to 4.0 percentage points as a direct consequence of the floods, with adverse human development effects in disaster-affected areas.
The size and duration of shocks will vary across locations and households, depending on the intensity of the flooding as well as the quality of relief and reconstruction efforts, the World Bank says in its latest ‘Macro Poverty Outlook for Pakistan’ released during the course of ongoing IMF-World Bank annual meetings.
According to the outlook made available on Saturday, the high inflation and devastating floods will have an adverse impact on poverty. While rising prices reduced the real purchasing power of all households, the floods primarily affected rural areas in Sindh and Balochistan where poverty rates are already high.
Poor households are more dependent on agricultural income and spend a larger share of their income on food, and therefore will be disproportionally affected by the loss of harvest and assets like housing and livestock, and rising prices, the report notes.
The economic outlook and prospects for overdue adjustment have been significantly affected by the floods. Agricultural output is expected to decline sharply, with losses to cotton, date, wheat, and rice crops. Nearly a million livestock is estimated to have perished.
Cotton losses are expected to weigh on the domestic textile industry and the wholesale and transportation service industries. Public relief and limited reconstruction activities are expected to partially offset the loss in activity.
Real GDP growth is therefore expected to slow to 2.0 percent in the fiscal year 2023 but recover to 3.2 percent by the fiscal year 2024, supported by a recovery in agricultural production, reconstruction efforts, and projected lower global inflationary pressures.
Due to higher energy prices, flood disruptions, and the weaker rupee, inflation is projected to rise to 23.0 percent in the fiscal year 2023 but moderate over the forecast horizon with declining international energy prices and resolution of flood-related supply constraints.
Despite flood-associated effects, the current account deficit is expected to narrow slightly to 4.3 percent of GDP in the fiscal year 2023 with slower domestic economic activity and is projected to shrink further in 2024 as exports recover from flood impacts.
In line with fiscal consolidation efforts, the fiscal deficit is projected to contract modestly to 6.8 percent of GDP in FY23, despite negative revenue impacts from the flooding and increased expenditure needs. The fiscal deficit is expected to gradually narrow over the medium term as revenue mobilization measures, particularly GST harmonization and personal income tax reform, take hold.
With rapid nominal GDP growth, public debt as a share of GDP is projected to decline gradually over the forecast period, despite continued primary deficits. The macroeconomic outlook is predicated on the IMF-EFF programme remaining on track.
The outlook notes that despite an economic rebound in FY21 and fiscal year 2022, persistent structural weaknesses of the Pakistani economy, such as low productivity growth due to low investment and exports, are hindering a sustained recovery.
Expansionary Covid-related macroeconomic policies supported aggregate demand that has contributed to pressures on domestic prices, the external sector, the exchange rate, and foreign reserves. In response, the Government, amid the ongoing monetary tightening, passed a contractionary 2023 budget and reversed unsustainable energy price subsidies.
India's official poverty estimates are more than a decade old. A consumption expenditure survey was last conducted in 2017-18 but its findings were never accepted by the govt.
https://theprint.in/economy/old-data-changing-methodology-why-number-of-indians-under-poverty-line-is-a-mystery/1168170/
Last year, the NITI Aayog had released its Multidimensional Poverty Index (MPI), which said that about one in every four Indians (25 per cent) was living in poverty. Unlike estimates mentioned earlier that focused largely on consumption expenditure, the MPI takes into account factors such as sanitation, schooling, access to drinking water, cleaner fuel etc.
How many Indians moved out of poverty?
The NSO, which conducts the crucial CES, falls under the purview of the Ministry of Statistics and Programme Implementation (MoSPI). According to a Press Information Bureau (PIB) release from earlier this year, year-long field work for the 2022-23 consumption expenditure survey was initiated by the central government in July.
The central government also conducts the Socio-Economic and Caste Census (SECC), through which it defines beneficiaries of poverty alleviation schemes.
However, India does not have up-to-date data for either of these surveys.
ThePrint reached MoSPI via phone and email for a response on when results of the latest CES will be published, but did not receive a response at the time of publication. This report will be updated when a response is received.
“Both the SECC and CES [latest data] are more than 10 years old, so, as of today, we do not know how many Indians have entered poverty and how many have moved out,” said Sen.
Human development economist Santosh Mehrotra added that consumption expenditure survey “has been used consistently for decades while revising poverty estimates and absence of this data means the government is denying itself an exact count on how many people are poor in this country”.
“I don’t think the results of the survey will be out before the 2024 elections. It could be consequential for the government as increase in poverty tarnishes its image of being effective in providing for the poor. In 2019, CES was leaked and then junked because it showed this government in poor light,” he told ThePrint.
Mehrotra also said that absence of poverty data may not impact the government’s policy decisions about programmes aimed at poverty reduction.
“This government’s policy decisions are dependent on political objectives. It keeps denying itself the actual poverty numbers and keeps reintroducing its free food grain scheme as elections near. I doubt if the absence of data is any hindrance in its public policy since it doesn’t want to believe in real data.”
https://youtu.be/d3KEjsHPgjo
https://hdr.undp.org/system/files/documents/hdp-document/2022mpireportenpdf.pdf
Poverty Index 2022
https://hdr.undp.org/system/files/documents/hdp-document/2022mpireportenpdf.pdf
A special section of this report highlights trends
over 15 years in India, where the number of poor people dropped by about 415 million. The poorest states
reduced poverty the fastest, and deprivations in all
indicators fell significantly among poor people. Poverty among children fell faster in absolute terms, although India still has the highest number of poor
children in the world (97 million, or 21.8 percent of
children ages 0–17 in India).6
----------
In India 415 million people exited poverty between 2005/06 and 2019/21, demonstrating that
the Sustainable Development Goal target 1.2 of
reducing at least by half the proportion of men,
women and children of all ages living in poverty in
all its dimensions according to national definitions
by 2030 is possible to achieve—and at scale. The
poorest states and groups (children, lower castes
and those living in rural areas) reduced poverty the
fastest in absolute terms, although the data do not
reflect post-Covid-19 pandemic changes.
• Of the 81 countries with trend data, covering
roughly 5 billion people, 72 experienced a statistically significant reduction in absolute terms in MPI
value during at least one of the periods analysed.
• Addressing poverty requires better data. The infrequency of household surveys makes it difficult to
assess the true impact of the COVID-19 pandemic
on poverty. The data revolution must not leave the
collection of poverty data behind.
---------
Table 1 at the end of the report presents global MPI estimates using the latest surveys available at the time of
computation. The year of the surveys ranges from 2010 to 2020/2021. This edition provides updated estimates for
12 countries, including India, and introduces estimates for three countries.2 The 2022 estimates are based on Multiple
Indicator Cluster Surveys for 54 countries, Demographic and Health Surveys for 45 countries and national surveys
for 12 countries. For 83 countries, home to 81.3 percent of poor people, data were fielded in 2016 or later—after the
Sustainable Development Goals were adopted. Of these, 35 countries, home to 37.1 percent of poor people, have
data fielded in 2019 or later. Harmonized trends are presented for 81 countries using data from 2000 to 2020/2021.
Of these, 35 countries have data for three points in time, and one country, Gambia, has data for four.
Although most data predate the COVID-19 pandemic, they nevertheless offer a reference point for measuring the
pandemic’s impact on poverty.
--------
The analysis first looks at the most common deprivation profiles across 111 developing countries (figure 1).
The most common profile, affecting 3.9 percent of
poor people, includes deprivations in exactly four
indicators: nutrition, cooking fuel, sanitation and
housing.7
More than 45.5 million poor people are deprived in only these four indicators.8
Of those people,
34.4 million live in India, 2.1 million in Bangladesh
and 1.9 million in Pakistan—making this a predominantly South Asian profile (figure 2).
The four deprivations in this bundle are embedded in other poverty profiles too. Beyond the
45.5 million poor people who are deprived in only
these four indicators, 328.9 million poor people are
deprived in these four indicators and others. Of the
374.4 million poor people deprived in these four indicators (some of whom are deprived in others),
224.8 million are in Sub-Saharan Africa, 122.9 million are in South Asia and 26.7 million are in other
regions.
https://hdr.undp.org/sites/default/files/Country-Profiles/MPI/PAK.pdf
Table A compares multidimensional poverty with monetary poverty measured by the percentage of the population living below 2011 PPP US$1.90 per day. It shows that monetary poverty only tells part of the story. The headcount or incidence of multidimensional poverty is 34.7 percentage points higher than the incidence of monetary poverty. This implies that individuals living above the monetary poverty line may still suffer deprivations in health, education and/or standard of living. Table A also shows the percentage of Pakistan’s population that lives in severe multidimensional poverty. The contributions of deprivations in each dimension to overall poverty complete a comprehensive picture of people living in multidimensional poverty. Figures for Bangladesh and India are also shown in the table for comparison.
-------
What is the global Multidimensional Poverty Index?
Sustainable Development Goal 1 aims to end poverty in all its forms everywhere. The global
Multidimensional Poverty Index (MPI) measures acute multidimensional poverty across more than 100
developing countries. It does so by measuring each person’s overlapping deprivations across 10 indicators
in three equally weighted dimensions: health, education and standard of living (see figure). The health and
education dimensions are based on two indicators each, while standard of living is based on six indicators.
All the indicators needed to construct the MPI for a country are taken from the same household survey.
Each indicator is equally weighted within its dimension, so the health and education indicators are weighted
1/6 each, and the standard of living indicators are weighted 1/18 each. The MPI is the product of the
headcount or incidence of multidimensional poverty (proportion of people who are multidimensionally poor)
and the intensity of multidimensional poverty (average share of weighted deprivations, or average
deprivation score,1 among multidimensionally poor people) and is therefore sensitive to changes in both
components. A deprivation score of 1/3 (one-third of the weighted indicators) is used to distinguish between
the multidimensionally poor and nonpoor. If the deprivation score is 1/3 or greater, the household (and
everyone in it) is classified as multidimensionally poor. Individuals with a deprivation score greater than or
equal to 1/5 but less than 1/3 are classified as vulnerable to multidimensional poverty. Finally, individuals
with a deprivation score greater than or equal to 1/2 live in severe multidimensional poverty. The MPI ranges
from 0 to 1, and higher values imply higher multidimensional poverty. The MPI complements the
international $1.90 a day poverty rate by identifying who is multidimensionally poor and also shows the
composition of multidimensional poverty.
@ajpirzada
Doesn't look good for Pak: the human capital index has stayed flat since 2005. While "avg years of schooling" has increased from 4 years in 2000 to 6 years in 2015 (Barro-Lee dataset), the quality has not improved. Worse, the gap with regional countries has increased since 80s.
https://twitter.com/ajpirzada/status/1583239244168200193?s=20&t=vJZdCxMsdx3c4vDdPyGlHw
https://www.livemint.com/opinion/columns/let-us-not-lose-sight-of-india-s-hunger-problem-11666199352750.html
For the second year in a row, India’s government has rejected the Global Hunger Index (GHI) ranking published by two international organizations: Concern Worldwide, an aid agency, and Welthun-gerhilfe, a non-profit entity, based, respectively, in Ireland and Germany. Their annual GHI report, which is peer reviewed, has been published for the past 17 years. India was ranked No. 107 out of 122 countries, below Bangladesh (at No. 84), Nepal (81), Pakistan (99) and Sri Lanka (64). Last year, India was No. 101 out of 116 countries. The government’s petulance stems from two reasons. One is that three of the four metrics forming the index use malnutrition data on children, i.e. wasting, stunting and premature mortality. Only one of the four metrics is on malnourishment, not malnutrition, and not even hunger. So how can the index based mainly on data for children be representative of the entire population? The second objection is about the sample size, which is 3,000. That is too low and not representative, according to the government. Some in government have even attributed mala fide intent to the publishers, who they say are more keen to taint India’s image than publish objective statistics. This is unfortunately becoming a routine ploy of discrediting adverse reports by either blaming the messenger or mongering conspiracy. This certainly won’t help, and India seems to be the only country upset about the GHI scores.
https://moderndiplomacy.eu/2022/10/20/fighting-against-poverty-the-impact-of-inflation-on-households-purchasing-power/
To ponder the question of happiness and happy countries, one can start with the World Happiness Index.
A quick perusal identifies several Scandinavian countries at the top (with Finland leading) and others also with high per capita GDP. Yet that alone is not sufficient for one also encounters anomalies. For example, India’s is higher than for Pakistan, but the latter is listed 66 in the index while India is almost hugging the bottom at 144. Moreover, the other major country in the subcontinent, Bangladesh, for all its turbulent history is still at 107 way ahead of India.
Other anomalies are South Korea and Japan at 62 and 63, far down the list from the other rich countries. Perhaps the cause here is a work ethic and social norms that informally require long hours at work coupled with expected socializing thereafter with colleagues.
Then there is the issue of inequality. One can indeed try to assess the impact of economic inequality through its measure, the Gini Coefficient expressed from 0 to 1. Sometimes it is written in percent terms as a number from 0 to 100 and it is then referred to as the Gini Index.
It matters little to the black South African that he earns more than other sub-Saharan Africans; what matters to him is his income in relation to others in South African society. It was an underlying cause of the riots last year in addition to the jailing of former president Jacob Zuma. The World Bank has named South Africa the most unequal country in the world.
Income inequality in the US has been on the rise since the 1970s when neo-liberalism in the Democratic party undermined the progressive taxes and regulations helping to bolster the middle class as well as safety nets for the poor. Who can forget how welfare was going to be replaced by ‘workfare’ and the stories, legion in the media, about families sitting at home getting ‘rich’ on welfare checks.
Yes, the rich got richer sheltering their money from taxes in the Cayman Islands or the Bahamas or the Isle of Man. Yet at the expense of the poor and the middle class with two-job families becoming the norm, and children in after-school programs because Mom wasn’t there to pick them up.
The World happiness Index summarizes what the neo-liberals achieved: the US is at the bottom of industrialized countries in North America and Europe. Of course an absence of a national health insurance program makes matters worse — it adds to worry, the antithesis of happiness.
An absence of worry, an absence of vast differences in income, social cohesion and a presence of a suitable safety net for when things go wrong. These appear to be the common denominators for happy countries.
And why not a Gross National Happiness (GNH) measure, as in Bhutan, in addition to the GDP. It is a philosophy that guides Bhutan.
http://www.fides.org/en/news/72953-ASIA_INDIA_Fight_against_poverty_and_hunger_in_India_between_good_results_and_necessary_commitments
India has rescued 415 million people from poverty in 15 years. This was stated in the new UN report on the "Multidimensional Poverty Index" (MPI), which analyzes the data collected between 2005 and 2021. The MPI, published jointly by the United Nations Development Program (UNDP) and the Oxford Poverty and Human Development Initiative (OPHI), notes that India continues to have the largest number of people in the world living below the poverty line (228 .9 million), followed by Nigeria (96.7 million), while the South Asian region as a whole, with its 385 million poor, follows sub-Saharan Africa, with 579 million destitute. While noting that, in general, the Covid-19 pandemic has slowed global progress in reducing poverty, the report notes that India as a nation over a period of 15 years, on this path of poverty reduction has obtained positive results.
In India, the report reads, there are 97 million poor children (data from 2021) which means that one in five children (21.8% of the total) suffers from poverty. According to the report, India is the only South Asian country where female-headed households are poorer than male-headed households (19.7% versus 15.9%) while 90% of the country's poor live in rural areas and 10% in urban areas.
Bihar remains the poorest state in the country, while the other 10 poorest states are Jharkhand, Meghalaya, Madhya Pradesh, Uttar Pradesh, Assam, Odisha, Chhattisgarh, Arunachal Pradesh and Rajasthan (West Bengal has dropped out of the top 10). The poor in India remain vulnerable due to rising food and fuel prices, the UN report emphasizes. "Policies that address the current nutrition and energy crises must be a priority. About 18.7% of the entire population of India is vulnerable to poverty.
However, the report also points to India's successes in lifting people out of absolute poverty: among the 415 million people, one group that benefits is children and youth aged 0-17.
"India is an important case study for the UN Sustainable Development Goals, the first of which is to end poverty in all its forms and reduce the percentage of men, women and children in poverty by at least half by 2030", reads the UN Report.
In a scenario that shows some progress but remains dire in absolute terms, the recent "Global Hunger Index 2022" (GHI) ranks India 107th out of 121 countries, the second worst position, after Afghanistan, compared to the rest of the South Asian countries. India's score (index 29.1) places it in the "country with a serious hunger problem" category. The Global Hunger Index is an annual report published jointly by the NGOs "Concern Worldwide" and "Welthungerhilfe", designed to exhaustively monitor hunger in the world in order to implement actions and processes to reduce this situation of hunger. The GHI is based on the values of four indicators: malnutrition, child stunting, wasting and infant mortality.
On the occasion of World Food Day, on October 16, the Food and Agriculture Organization (FAO) announced that the number of people in conditions of food insecurity in the world has increased again, and there are now 828 million people in the world who do not have access to food, as noted in the 2022 report "The State of Food Security and Nutrition in the World".
Between 1990 and 2021, Pakistan's HDI value changed from 0.400 to 0.544, an change of 36.0 percent.
Between 1990 and 2021, Pakistan's life expectancy at birth changed by 6.0 years, mean years of schooling changed by 2.2 years and expected years of schooling changed by 4.0 years. Pakistan's GNI per capita changed by about 62.7 percent between 1990 and 2021.
https://hdr.undp.org/data-center/specific-country-data#/countries/PAK
-------
Pakistan has dropped seven places in the Human Development Index, ranking 161 out of 192 countries in the 2021-2022 HDI, according to the UNDP report released on Thursday.
https://www.thenews.com.pk/print/989724-pakistan-down-on-human-development-index-by-7-slots
In the previous year, Pakistan had stood at 154 out of 189 countries.
As per the report, Pakistan’s life expectancy at birth is 66.1 years and expected years of schooling are 8. The country’s gross per capita national income is $4,624. The report has identified that different climate shocks are affecting world order, pushing back the growth that was achieved in the past few years. While doing so, it has categorised the floods in Pakistan as “an example of the climate shocks seen around the world.”
Switzerland leads the way on the latest HDI while Norway and Iceland enjoy second and third positions. Among the nine South Asian countries -- Afghanistan, Bangladesh, Bhutan, India, Islamic Republic of Iran, Maldives, Nepal, Pakistan, Sri Lanka -- only Pakistan and Afghanistan (180th position) are in the low human development category.
Bhutan (127), Bangladesh (129), India (132) and Nepal (143) are in the medium human development category. And crisis-riddled Sri Lanka has managed to improve its position by 9 points, reaching the 73rd position on the index, finding itself in the high human development category. Iran is three positions behind at 76; the next is Maldives at the 90th position.
The report, titled ‘Uncertain Times, Unsettled Lives: Shaping our Future in a Transforming World’ has found out that around 90 per cent of countries have seen “reversals in human development” in the year of the survey, pointing to a world stuck in a never-ending cycle of crisis after crisis, causing global disruptions. Per the report, the two major factors responsible for these disruptions were the Covid-19 pandemic and the Russia-Ukraine war.
The Human Development Index is a measure of countries’ standard of living, health and education. This is the first time in the last 30 years that human development in a majority of countries has gone in reverse for two consecutive years.
This has pushed human development to its 2016 levels, a huge blow to the progress made on the Sustainable Development Goals (SDGs) that were meant to be completed by 2030. For the year 2021, the UN had projected an HDI value of 0.75 -- the actual value has come out to be 0.732.
The report adds that the world is in a “new uncertainty complex”. Such uncertainty is created by the two years of Covid-19 which saw a series of the lethal waves of the virus.
Even though the world took quick steps to defeat the virus, the report notes, and developed vaccines to counter the threats, unequal distribution of the vaccines has created more problems in a number of low-income countries.
The pandemic-induced lockdowns and school closures also took a toll on people’s mental wellbeing across the world. The report has found out that mental distress among male minority groups in the UK saw the largest increase, and men from Bangladesh, India and Pakistan were the most affected by the disruptions caused by the pandemic.
https://journalsofindia.com/world-bank-report-on-poverty-2022/
Key findings of the report-
It stated that the world is unlikely to meet the goal of ending extreme poverty by 2030 absent history-defying rates of economic growth over the remainder of this decade.
By 2015, the global extreme-poverty rate had been cut by more than half. Since then, poverty reduction has slowed in tandem with subdued global economic growth.
The economic upheavals brought on by COVID-19 and later the war in Ukraine produced an outright reversal in progress.
------------
India’s poverty levels-
Poverty has gone up in India too. Previous estimates suggested a poverty headcount rate at the US$1.90 poverty line of 10.4 percent in 2017.
The latest estimate based on Sinha Roy and van der Weide (2022) shows that poverty at the US$1.90 poverty line was 13.6 percent in 2017.
However, the report uses data from the Centre for Monitoring Indian Economy (CMIE), because there are no official estimates of poverty available since 2011.
The most recent survey data released by the National Sample Survey Office of India used to measure poverty is the 2011/12 National Sample Survey (NSS). The government decided not to release the 2017/18 NSS round because of concerns about data quality.
https://blogs.worldbank.org/opendata/september-2022-global-poverty-update-world-bank-2017-ppps-and-new-data-india
The PIP website also now includes five new rounds of survey data for India (2015/16, 2016/17, 2017/18, 2018/19, 2019/20). These data are based on the work by Roy and Van der Weide (2022) who use household survey data from the Consumer Pyramids Household Survey (CPHS) conducted by the Center for Monitoring Indian Economy (CMIE). With these new data, poverty in India has declined in recent years, but less than previously estimated (see Figure 2 here). Hence, the inclusion of the new data leads to an increase in the poverty rate in India and South Asia, as well as the world (more than offsetting the PPP impact described above). Earlier estimates suggested a poverty headcount rate at the $1.90 poverty line (and 2011 PPPs) of 10.4 percent in 2017, compared with 13.6 percent in Roy and Van der Weide (2022).
https://economictimes.indiatimes.com/news/economy/indicators/imf-on-india-slow-recovery-dull-external-demand-to-mark-fy23/articleshow/95130011.cms
A further slowdown of India's growth to 6.1% is expected in FY24 as external demand and a tightening in monetary and financial conditions weigh
on growth, the IMF said in its Regional Economic Outlook.
Noting that there have been "significant" portfolio outflows from Asia so far this year, it said at a regional level the scale of the outflows from Asian emerging markets is comparable to previous episodes such as the 2013 taper tantrum and the 2020 onset of the Covid-19 pandemic.
While strong outflow pressures have been focused on a handful of economies such as India, it said that recent data point to outflows having stabilised and partially reversed. "In the countries facing the most volatility in net portfolio flows, these seem predominantly driven by equity instead of debt flows (India, Thailand). These flows and the differentiation of equity prices have responded to changes in growth expectations," the IMF said.
As per the report, several Asian emerging market and developing economies have seen a decumulation of their international reserves-between 3-10% of their holdings in the first half of 2022 in India, Indonesia, the Philippines and Thailand-especially during periods of intense external financial shocks.
Most economies in Asia and Pacific, including Australia and India, are consolidating fiscal policy alongside monetary policy following substantial support during the pandemic, according to the outlook.
On the Russia-Ukraine war, it said the rise in crude oil, natural gas, coal and agricultural commodity prices in the first half of 2022 has been a negative terms-of-trade shock for most of the region and placed strain on the external accounts of large net importers in India.
The IMF also said India would need to spend 6.2% of gross domestic product each year to achieve the Sustainable Development Goals in 2030, and these resource requirements are compounded by less ess favourable debt dynamics.
Crypto currency
On crypto currency, the IMF said policy response should include investments to modernize digital payment systems-including cross-border integration-and the eventual issuance of central bank digital currencies.
India introduced a 30% tax on income derived from crypto trading and is currently developing a regulatory framework like many countries in the region.
"An important aspect of the policy response should include investments to modernize digital payment systems-including cross-border integration-and the eventual issuance of central bank digital currencies, which could offer consumers many of the benefits of crypto without the risks," it said.
The pandemic has accelerated digitalization around the world, including in many Asian emerging markets and developing economies, and e-commerce revenues have increased, with particularly rapid expansion in some emerging markets such as India and Indonesia.
https://www.pakistanlink.org/Opinion/2022/Nov22/11/07.HTM
These are substantial, undeniable achievements that hubris-filled Hindu nationalists say derive from their greatness as an ancient civilization. But wait! China has done still better. And, though far smaller, many emergent countries of East Asia — Japan, South Korea, Vietnam, and Singapore — also boast of better performance than India’s.
In every case, the secret of success is well-known — strong systems of education that create skills, knowledge, attitudes and social behavior’s suited for modern times. Together with that, a strong work ethic in the labor force. Stated differently, high national achievement springs naturally from the quickness with which a country universalizes or ‘Westernizes’ its education and creates positive attitudes towards work.
Here’s how India grew into the present. Empowered by the scientific and industrial revolutions, Britain colonized India and sought to spread Western education and values. Conservative Hindus emphatically rejected this modernization butsar reformist movements such as Brahmo Samaj under Ram Mohan Roy and others made deep inroads.
By 1947 under Jawaharlal Nehru — an avowed Hindu atheist devoted to the ‘scientific temper’ — India was already intellectually equipped to enter the modern world. For the next 50 years, India’s education sought to create a pluralist, secular, scientifically minded society. It reaps rich harvests to the present day — which the BJP happily appropriates as its own.
But Hindu nationalists now want India’s goals and self-image drastically revised. Modi’s second engine, fueled by febrile imaginations, pushes India towards emulating some kind of Hindu rashtra from an idyllic past. My friend Prof Badri Raina, now retired from Delhi University, says that “this backward engine would have us believe that in ancient times we had knowledge of plastic surgery, aeronautics, satellite vision, even as streams of foaming white milk flowed down our plains, and golden birds perched on the branches of trees”.
---------
The loudest call for reforming Muslim education was that of Sir Syed Ahmad Khan. Madressahs, he said, are entirely unnecessary. Using religious idiom, he passionately argued for science and modernity. While his efforts led to some measure of functionality and to jobs within the colonial system, they were nowhere deep or wide as that of Brahmo Samaj. Conservative backlash limited Sir Syed’s influence.
Thus, by the time Partition came around, there was a massive Hindu-Muslim gap. Nevertheless, for the first few decades, Pakistan’s engine #1 steadily gained strength and was consistently stronger than its second engine. Among other things, Pakistan’s space program (born 1961, now dead) much preceded India’s.
The decline in India’s rankings on a number of global opinion-based indices are due to "cherry-picking of certain media reports" and are primarily based on the opinions of a group of unknown “experts”, a recent study has concluded.
A new working paper titled "Why India does poorly on global perception indices" found that while such indices cannot be ignored as "mere opinions" since they feed into World Bank’s World Governance Indicators (WGI), there needs to be a closer inspection on the methodology used to arrive at the data.
https://timesofindia.indiatimes.com/india/indias-declining-rank-in-global-indices-due-to-serious-problems-in-methodology-analysis/articleshow/95692106.cms
The findings were published by Sanjeev Sanyal, member of the Economic Advisory Council to the Prime Minister and Aakanksha Arora, deputy director of (EAC to PM).
In the report, the authors conducted a case study of three o ..
In the report, the authors conducted a case study of three
opinion-based indices: Freedom in the World index, EIU
Democracy index and Variety of Democracy.
They drew four broad conclusions from the study:
1) Lack of transparency: The indices were primarily based on
the opinions of a tiny group of unknown “experts”.
2) Subjectivity: The questions used were subjective and
worded in a way that is impossible to answer objectively
even for a country.
3) Omission of important questions: Key questions which
are pertinent to a measure of democracy, like “Is the head of
state democratically elected?”, were not asked.
4) Ambiguous questions: Certain questions used by these
indices were not an appropriate measure of democracy
across all countries.
Here's a look at the three indices examined by the study:
Freedom in the World Index
India’s score on the US-based Freedom in the World Index —
an annual global report on political rights and civil liberties
— has consistently declined post 2018.
It's score on civil liberties was flat at 42 till 2018 but dropped
sharply to 33 by 2022. It's political rights score dropped from
35 to 33. Thus, India’s total score dropped to 66 which places
India in the “partially free” category – the same status it had
during the Emergency.
The study found that only two previous instances where
India was considered as Partially Free was during the time of
Emergency and then during 1991-96 which were years of
economic liberalisation.
"Clearly this is arbitrary. What did the years of Emergency,
which was a period of obvious political repression,
suspended elections, official censoring of the press, jailing of
opponents without charge, banned labour strikes etc, have
in common with period of economic liberalisation and of
today," the study asked.
It concluded that the index "cherry-picked" some media
reports and issues to make the judgement.
The authors further found that in Freedom House's latest
report of 2022, India’s score of the Freedom in the World
Index is 66 and it is in category "Partially Free".
"Cross country comparisons point towards the arbitrariness
in the way scoring is done. There are some examples of
countries which have scores higher than India which seem
clearly unusual. Northern Cyprus is considered as a free
territory with a score of 77 (in 2022 report). It is ironical as
North Cyprus is not even recognised by United Nations as a
country. It is recognised only by Turkey," the authors noted.
Economist Intelligence Unit
In the Economist Intelligence Unit (EIU) Democracy Index,
published the research and consulting arm of the firm that
publishes the Economist magazine, India is placed in the
category of “Flawed Democracy”.
Its rank deteriorated sharply from 27 in 2014 to 53 in 2020
and then improved a bit to 46 in 2021. The decline in rank
has been on account of decline in scores primarily in the
categories of civil liberties and political culture.
The authors found that list of questions used to determine
the outcome was "quite subjective", making objective
https://www.cnn.com/2022/03/17/opinions/india-farmer-suicide-agriculture-reform-kaur/index.html#:~:text=The%20situation%20for%20India's%20more,typically%20due%20to%20overwhelming%20debt.
India’s economic backbone – its farmers and their families – is in collapse. They face crushing pressures: insurmountable debt, environmental degradation, and extreme rates of cancer linked to exposure to pesticides.
https://www.thenewhumanitarian.org/news-feature/2022/12/19/India-hunger-starvation-data-malnutrition
The government is accused of failing to log starvation deaths, while the safety net isn’t catching all it should.
The government hasn’t logged a single death from starvation since 2016, but Mrinalini Paul, who works with the Right to Food and Work Network (RTFWN), a local NGO, said it’s clear Sardar’s death should have been recorded as one, as should many others.
The Sardar family was eligible for 35 kilos of rice and grain monthly from a government-run aid programme but had been approved for just two kilos because they lacked the right ID documents, according to Paul. “They had been without even these minimal benefits for six months,” she told The New Humanitarian.
Sunil Agarwala, the district magistrate of Jhargram, refuted the allegations, telling The Hindu newspaper they were "baseless", while insisting that Sardar’s death “was due to illness, TB, and other reasons”.
According to the World Health Organization, undernutrition is a key driver of TB, while malnutrition also makes TB therapy less effective and raises the risk of TB-related death.
The recently published Medical Certification Cause of Death (MCCD), 2020 report found that fewer than a quarter of the 81,15,882 registered deaths in India that year had known causes. Hunger activists are alarmed that a country with 1.4 billion people can only verify the causes of 22.5% of its documented fatalities.
Swati Narayan, assistant professor at the School for Public Health and Human Development at O.P. Jindal Global University, told The New Humanitarian that medical workers are unlikely to catch if the cause of death is starvation given how post-mortems are typically carried out.
She said it was crucial to also consider the person's socioeconomic position and the condition of their body, including the weight of their organs, visceral fat, and diseases brought on by a weaker immune system and malnutrition.
“The post-mortem reports are not an accurate reflection of hunger or starvation deaths in the country,” Narayan said. “Oral autopsies are much better at determining if the cause of death was hunger.”
Worsening hunger and the fight for a stronger safety net
Question marks around Sardar’s death and others like it – a similar case involving three “hunger deaths” in the same family went before the high court last month in Jharkhand, which borders West Bengal to the east – come amid signs of growing food insecurity in India.
The 2022 Global Hunger Index ranks India at 107 out of 121 nations, six places lower than its previous ranking, and below the likes of Ethiopia, Bangladesh, and Pakistan.
While India remains in the “serious” category rather than “alarming” or “very alarming”, it recorded the highest percentage (19.3%) of any country of children under five who are “wasting”, meaning they’re below average weight for their height.
The pandemic made hunger worse, but income losses and rising debt continued to drive it up long after the worst of the health crisis had passed. A survey by the Right to Food Campaign in late 2021/early 2022 found that nearly 80% of respondents faced food insecurity, and almost half had run out of food the previous month.
However, the hunger problems also pre-date COVID. India’s last National Family Health Survey, which used data from 2019, found that stunting – a sign of chronic malnutrition – had risen in 11 out of the 17 states. In 13 states, wasting had also increased.
Narendra Modi often overstates his achievements. For example, the Hindu-nationalist prime minister’s claim that all Indian villages have been electrified on his watch glosses over the definition: only public buildings and 10% of households need a connection for the village to count as such. And three years after Mr Modi declared India “open-defecation free”, millions of villagers are still purging al fresco. An absence of up-to-date census information makes it harder to check such inflated claims. It is also a disaster for the vast array of policymaking reliant on solid population and development data.
----------
Three years ago India’s government was scheduled to pose its citizens a long list of basic but important questions. How many people live in your house? What is it made of? Do you have a toilet? A car? An internet connection? The answers would refresh data from the country’s previous census in 2011, which, given India’s rapid development, were wildly out of date. Because of India’s covid-19 lockdown, however, the questions were never asked.
Almost three years later, and though India has officially left the pandemic behind, there has been no attempt to reschedule the decennial census. It may not happen until after parliamentary elections in 2024, or at all. Opposition politicians and development experts smell a rat.
----------
For a while policymakers can tide themselves over with estimates, but eventually these need to be corrected with accurate numbers. “Right now we’re relying on data from the 2011 census, but we know our results will be off by a lot because things have changed so much since then,” says Pronab Sen, a former chairman of the National Statistical Commission who works on the household-consumption survey. And bad data lead to bad policy. A study in 2020 estimated that some 100m people may have missed out on food aid to which they were entitled because the distribution system uses decade-old numbers.
Similarly, it is important to know how many children live in an area before building schools and hiring teachers. The educational misfiring caused by the absence of such knowledge is particularly acute in fast-growing cities such as Delhi or Bangalore, says Narayanan Unni, who is advising the government on the census. “We basically don’t know how many people live in these places now, so proper planning for public services is really hard.”
The home ministry, which is in charge of the census, continues to blame its postponement on the pandemic, most recently in response to a parliamentary question on December 13th. It said the delay would continue “until further orders”, giving no time-frame for a resumption of data-gathering. Many statisticians and social scientists are mystified by this explanation: it is over a year since India resumed holding elections and other big political events.
https://international.princeton.edu/news/why-prof-ashoka-mody-believes-india-broken
I have long felt that that upbeat story is completely divorced from the lived reality of the vast majority of Indians. I wanted to write a book about that lived reality, about jobs, education, healthcare, the cities Indians live in, the justice system they encounter, the air they breathe, the water they drink. And when you look at India through that lens of that reality, the progress is halting at best and far removed from the aspirations of people and what might have been. India is broken in the sense that for hundreds of millions of Indians, jobs are hard to get, and education and health care are poor. The justice system is coercive and brutal. The air quality remains extraordinarily poor. The rivers are dying. And it's not clear that things are going to get better. Underlying that brokenness, social norms and public accountability have eroded to a point where India seems to be in a catch-22: Unaccountable politicians do not impose accountability on themselves; therefore, no one has an incentive to impose accountability for policy priorities that might benefit large numbers of people. The elite are happy in their gated first-world communities. They shrug their shoulders and say, “What exactly is the problem?”
———
Prof Ashoka Mody interviewed by Barkha Dutt
https://www.youtube.com/watch?v=L8SEmML71KQ
Bangladesh 54%
Pakistan 54%
India 74%
https://data.worldbank.org/indicator/SL.EMP.VULN.ZS?locations=PK-IN-BD
------------
Sandeep Manudhane
@sandeep_PT
Why the size of the economy means little
a simple analysis
1) We are often told that India is now a $3.5 trillion economy. It is growing fast too. Hence, we must be happy with this growth in size as it is the most visible sign of right direction. This is the Quantity is Good argument.
2) We are told that such growth can happen only if policies are right, and all engines of the GDP - consumption, exports, investment, govt. consumption - are doing their job well. We tend to believe it.
3) We are also told that unless GDP grows, how can Indians (on average) grow? Proof is given to us in the form of 'rising per capita incomes' of India. And we celebrate "India racing past the UK" in GDP terms, ignoring that the average Indian today is 20 times poorer than the average Britisher.
4) All this reasoning sounds sensible, logical, credible, and utterly worth reiterating. So we tend to think - good, GDP size on the whole matters the most.
5) Wrong. This is not how it works in real life.
6) It is wrong due to three major reasons
(a) Distribution effect
(b) Concentration of power effect
(c) Inter-generational wealth and income effect
7) First comes the distribution effect. Since 1991, the indisputable fact recorded by economists is that "rich have gotten richer, and poor steadily stagnant or poorer". Thomas Piketty recorded it so well he's almost never spoken in New India now! Thus, we have a super-rich tiny elite of 2-3% at the top, and a vast ocean of stagnant-income 70-80% down below. And this is not changing at all. Do not be fooled by rising nominal per capita figures - factor in inflation and boom! And remember - per capita is an average figure, and it conceals the concentration.
8) Second is the Concentration of power effect. RBI ex-deputy governor Viral Acharya wrote that just 5 big industrial groups - Tata, Birlas, Adanis, Ambanis, Mittals - now disproportionately own the economic assets of India, and directly contribute to inflation dynamics (via their pricing power). This concentration is rising dangerously each year for some time now, and all government policies are designed to push it even higher. Hence, a rising GDP size means they corner more and more and more of the incremental annual output. The per capita rises, but somehow magically people don't experience it in 'steadily improving lives'.
9) Third is the Inter-generational wealth and income effect. Ever wondered why more than 90% of India is working in unstructured, informal jobs, with near-zero social security? Ever wondered why rich families smoothly pass on 100% of their assets across generations while paying zero taxes? Ever wondered how taxes paid by the rich as a per cent of their incomes are not as high as those paid by you and me (normal citizens)? India has no inheritance tax, but has a hugely corporate-friendly tax regime with many policies tailor-made to augment their wealth. Trickle down is impossible in this system. But that was the spiel sold to us in 1991, and later, each year! There is no incentive for giant corporates (and rich folks) to generate more formal jobs, as an ocean of underpaid slaves is ready to slog their entire lives for them. Add to that automation, and now, AI systems!
SUMMARY
Sadly, as India's GDP grows in size, it means little for the masses because trickle-down is near zero. That is because new formal jobs aren't being generated at scale at all (which in itself is a big topic for analysis).
So, our Quantity of GDP is different from Quality of GDP.
https://twitter.com/sandeep_PT/status/1675421203152896001?s=20
https://indianexpress.com/article/india/income-of-poorest-fifth-plunged-53-in-5-yrs-those-at-top-surged-7738426/
In a trend unprecedented since economic liberalisation, the annual income of the poorest 20% of Indian households, constantly rising since 1995, plunged 53% in the pandemic year 2020-21 from their levels in 2015-16. In the same five-year period, the richest 20% saw their annual household income grow 39% reflecting the sharp contrast Covid’s economic impact has had on the bottom of the pyramid and the top.
---------------
A new survey, which highlights the economic impact of the pandemic on Indian households, found that the income of the poorest 20 percent of the country declined by 53 percent in 2020-21 from that in 2015-16.
https://www.thequint.com/news/india/poor-in-india-lose-half-their-income-in-last-5-years-rich-got-richer-survey#read-more
The survey, conducted by the People's Research on India's Consumer Economy (PRICE), a Mumbai-based think tank, also shows that in contrast, the same period saw the annual household income of the richest 20 percent grow by 39 percent.
Conducted between April and October 2021, the survey covered 20,000 households in the first stage, and 42,000 households in the second stage. It spanned over 120 towns and 800 villages in 100 districts.
Income Erosion in All Households Except the Rich Ones
The survey indicated that while the poorest 20 percent households witnessed an income erosion of 53 percent, the lower-middle-class saw a 39-percent decline in household income. The income of the middle-class, meanwhile, reduced by 9 percent.
However, the upper-middle-class and richest households saw their incomes rise by 7 percent and 39 percent, respectively.
The survey also showed that the richest households, on an average, accumulated more income per household as well as pooled income in the past five years than any other five-year period since liberalisation.
While the richest 20 percent accounted for 50.2 percent of the total household income in 1995, the survey shows that their share jumped to 56.3 percent in 2021. In contrast, the share of the poorest 20 percent dropped from 5.9 percent to 3.3 percent in the same period.
While 90 percent of the poorest 20 percent in 2016 lived in rural India, the figure dropped to 70 percent in 2021. In urban areas as well, the share of the poorest 20 percent households went from 10 percent in 2016 to 30 percent in 2021.
"The data reflects that casual labourers, petty traders, household workers, among others, in Tier 1 and Tier 2 cities got hit the most by the pandemic. During the survey, we also noticed that while in rural areas, people in the lower middle income category (Q2) moved to the middle income category (Q3), in the urban areas, the shift has been downwards, from Q3 to Q2. In fact, the rise in poverty level of the urban poor has pulled down the household income of the entire category," reported The Indian Express, quoting Rajesh Shukla, MD and CEO of PRICE.
Most Middle-Class Breadwinners Are Illiterate or Have Primary Schooling
The survey further shows that while a majority of the breadwinners in 'Rich India' (top 20 percent) have completed high-school education (60 percent, of which 40 percent are graduates and above), nearly half of 'Middle India' (60 percent) only have primary education.
As for the bottom 20 percent, 86 percent are either illiterate or just have primary education. Only 6 percent are graduates and above.
(With inputs from The Indian Express, ICE360 2021 Survey.)
(At The Quint, we are answerable only to our audience. Play an active role in shaping our journalism by becoming a member. Because the truth is worth it.)
Postponing India’s census is terrible for the country
But it may suit Narendra Modi just fine
https://www.economist.com/asia/2023/01/05/postponing-indias-census-is-terrible-for-the-country
Narendra Modi often overstates his achievements. For example, the Hindu-nationalist prime minister’s claim that all Indian villages have been electrified on his watch glosses over the definition: only public buildings and 10% of households need a connection for the village to count as such. And three years after Mr Modi declared India “open-defecation free”, millions of villagers are still purging al fresco. An absence of up-to-date census information makes it harder to check such inflated claims. It is also a disaster for the vast array of policymaking reliant on solid population and development data.
----------
Three years ago India’s government was scheduled to pose its citizens a long list of basic but important questions. How many people live in your house? What is it made of? Do you have a toilet? A car? An internet connection? The answers would refresh data from the country’s previous census in 2011, which, given India’s rapid development, were wildly out of date. Because of India’s covid-19 lockdown, however, the questions were never asked.
Almost three years later, and though India has officially left the pandemic behind, there has been no attempt to reschedule the decennial census. It may not happen until after parliamentary elections in 2024, or at all. Opposition politicians and development experts smell a rat.
----------
For a while policymakers can tide themselves over with estimates, but eventually these need to be corrected with accurate numbers. “Right now we’re relying on data from the 2011 census, but we know our results will be off by a lot because things have changed so much since then,” says Pronab Sen, a former chairman of the National Statistical Commission who works on the household-consumption survey. And bad data lead to bad policy. A study in 2020 estimated that some 100m people may have missed out on food aid to which they were entitled because the distribution system uses decade-old numbers.
Similarly, it is important to know how many children live in an area before building schools and hiring teachers. The educational misfiring caused by the absence of such knowledge is particularly acute in fast-growing cities such as Delhi or Bangalore, says Narayanan Unni, who is advising the government on the census. “We basically don’t know how many people live in these places now, so proper planning for public services is really hard.”
The home ministry, which is in charge of the census, continues to blame its postponement on the pandemic, most recently in response to a parliamentary question on December 13th. It said the delay would continue “until further orders”, giving no time-frame for a resumption of data-gathering. Many statisticians and social scientists are mystified by this explanation: it is over a year since India resumed holding elections and other big political events.
By Manoj Kumar
https://www.reuters.com/world/india/one-tenth-indias-population-escaped-poverty-5-years-government-report-2023-07-17/
NEW DELHI, July 17 (Reuters) - Nearly 135 million people, around 10% of India's population, escaped poverty in the five years to March 2021, a government report found on Monday.
Rural areas saw the strongest fall in poverty, according to the study, which used the United Nations' Multidimensional Poverty Index (MPI), based on 12 indicators such as malnutrition, education and sanitation. If people are deprived in three or more areas, they are identified as "MPI poor."
"Improvements in nutrition, years of schooling, sanitation and cooking fuel played a significant role in bringing down poverty," said Suman Bery, vice-chairman of the NITI Aayog, the government think-tank that released the report.
The percentage of the population living in poverty fell to 15% in 2019-21 from 25% in 2015/16, according to the report, which was based on the 2019-21 National Family Health Survey.
A report by the United Nations Development Programme (UNDP) released last week said the number of people living in multidimensional poverty fell to 16.4% of India's population in 2021 from 55% in 2005.
According to UNDP estimates, the number of people, who lived below the $2.15 per day poverty line had declined to 10% in India in 2021.
India's federal government offers free food grain to about 800 million people, about 57% of country's 1.4 billion population, while states spend billions of dollars on subsidising education, health, electricity and other services.
The state that saw the largest number moving out of poverty was Uttar Pradesh, with 343 million people, followed by the states of Bihar and Madhya Pradesh, according to the report.
Reporting by Manoj Kumar; Editing by Conor Humphries
@BhavikaKapoor5
𝑷𝒓𝒐𝒑𝒂𝒈𝒂𝒏𝒅𝒂:
- 5th largest economy 🚩
- 5 trillon economy 🐄
𝑻𝒓𝒖𝒕𝒉:
𝗜𝗻𝗱𝗶𝗮'𝘀 𝗦𝗲𝗰𝘁𝗼𝗿𝘀 𝗼𝗳 𝗚𝗗𝗣 𝘁𝗵𝗮𝘁 𝗛𝗮𝘃𝗲 𝗖𝗼𝗻𝘀𝗶𝘀𝘁𝗲𝗻𝘁𝗹𝘆 𝗣𝗲𝗿𝗳𝗼𝗿𝗺𝗲𝗱 𝗣𝗼𝗼𝗿𝗹𝘆 𝗦𝗶𝗻𝗰𝗲 𝟮𝟬𝟭𝟰:
𝗠𝗮𝗻𝘂𝗳𝗮𝗰𝘁𝘂𝗿𝗶𝗻𝗴: The manufacturing sector has grown at an average rate of just 3.5% per year since 2014. This is well below the average growth rate of average 6% for the overall economy. The slow growth of the manufacturing sector is a major concern, as it is a key driver of job creation and economic growth. Poor performance of manufacturing in GDP is one of the major reasons of massive unemployment in India
𝗜𝗻𝗳𝗿𝗮𝘀𝘁𝗿𝘂𝗰𝘁𝘂𝗿𝗲: The infrastructure sector has also performed poorly in recent years. The growth rate of the infrastructure sector has averaged just 2% per year since 2014. This is below the average growth rate of 6% for the overall economy. The slow growth of the infrastructure sector is a major constraint on economic growth, as it limits the ability of businesses to expand and create jobs.
𝗔𝗴𝗿𝗶𝗰𝘂𝗹𝘁𝘂𝗿𝗲: The agriculture sector has also performed poorly in recent years. The growth rate of the agriculture sector has averaged just 2% per year since 2014. This is below the average growth rate of 6% for the overall economy. The slow growth of the agriculture sector is a major concern, as it is a key source of livelihood for millions of Indians.
𝗖𝗼𝗻𝘀𝘁𝗿𝘂𝗰𝘁𝗶𝗼𝗻:
The construction sector has grown at an average rate of just 2.5% per year since 2014. This is well below the average growth rate of 6% for the overall economy. The slow growth of the construction sector is a major concern, as it is a key driver of job creation (as it gives employment to unskilled workforce too) and economic growth.
𝗕𝗮𝗻𝗸𝗶𝗻𝗴 𝗮𝗻𝗱 𝗙𝗶𝗻𝗮𝗻𝗰𝗶𝗮𝗹 𝗦𝗲𝗿𝘃𝗶𝗰𝗲𝘀:
India's banking and financial services sector has faced a multitude of challenges, primarily in the form of non-performing assets (NPAs) and the resulting stress on bank balance sheets. The burden of NPAs, coupled with regulatory issues, limited credit availability, and risk-averse lending practices, has impacted the sector's ability to fuel economic growth. Additionally, the sector has witnessed instances of fraud and mismanagement, eroding investor confidence.
𝗣𝗼𝘄𝗲𝗿 𝗮𝗻𝗱 𝗘𝗻𝗲𝗿𝗴𝘆:
Despite efforts to improve power generation and distribution, India's power and energy sector has struggled to keep pace with the growing demand. Issues like inadequate infrastructure, transmission losses, fuel supply constraints, and pricing challenges have hampered the sector's progress. The heavy reliance on fossil fuels has also posed environmental challenges, requiring a shift towards cleaner and renewable energy sources.
In summary, addressing the above highlighted issues will require a comprehensive approach, involving policy reforms, infrastructure development, skill enhancement, and investment in research and development. However, I don't think Modi government has the talent, vision and political willingness to handle such complex issues.
https://twitter.com/BhavikaKapoor5/status/1680910458742767616?s=20
https://www.financialexpress.com/industry/sme/msme-eodb-over-10000-msmes-shut-during-2016-2022-period-96-in-past-3-years-shows-govt-data/2605518/
Ease of Doing Business for MSMEs: The government has come out with consolidated data on the number of MSMEs closed over the past six years including the Covid period in the country. According to the combined data from the Udyam registration portal and the erstwhile Udyog Aadhaar Memorandum (UAM), 10,067 MSMEs were shut from 2016 to 2022.
Sharing data in the Rajya Sabha on Monday in a written reply to a question on the closure of units, Minister of State for MSMEs Bhanu Pratap Singh Verma noted that 400 MSMEs (4 per cent of total closures) were shut during the 2016-2019 period as per the UAM data. On the other hand, the majority 96 per cent units — 9,667 were shut between 2019 and 2022, according to the UAM and Udyam portal data.
In reply to a separate question on the Covid impact on MSMEs, Verma shared that 2,870 MSMEs registered on the Udyam portal were shut between April 1, 2022, and July 20, 2022, along with employment loss for 19,862 people. Likewise, 6,222 Udyam-registered MSMEs were shut in FY22 with 42,662 people losing jobs. Between July 1, 2020, and March 31, 2021, 175 Udyam units were closed and 724 jobs were lost.
“Closure of MSMEs is certainly a concern for the government for which necessary steps and studies have been undertaken. The closure is one of the reasons cited by units for cancelling their MSME registrations, but the reason for closure is not always mentioned by them. Other reasons for cancelling registrations include stopping the manufacturing of goods or moving to other businesses or they just don’t need the registration anymore,” Ishita Ganguli Tripathy, Additional Development Commissioner, Ministry of MSME told Financial Express Online.
Citing studies by SIDBI, SBI, and others, Tripathy noted that while there have been closures, some of them have been temporary and due to schemes such as Emergency Credit Line Guarantee Scheme (ECLGS), many MSMEs have been able to save employment as well.
https://reliefweb.int/report/pakistan/benazir-nashonuma-programme-delivering-breakthrough-results-preventing-malnutrition
Operating under Pakistan’s Benazir Income Support Programme (BISP) – the country's flagship social protection programme – the Benazir Nashonuma Programme has become a cornerstone in the fight against malnutrition in Pakistan.
The final results of the cohort study of the Independent Impact Evaluation presented in May 2026 show some of the strongest results ever documented globally for a nutrition programme, with impact on stunting reduction and child survival. The evaluation is conducted by the Institute for Global Health & Development at Aga Khan University and funded by the Gates Foundation. It followed two groups from early pregnancy – Nashonuma participants and non-participants – both enrolled in BISP Kafaalat.
The evaluation has documented significant impact on maternal outcomes, including full coverage of antenatal care (at least once), improved pregnancy weight gain (+24 g/week), and 0.36 g/dL smaller decline in hemoglobin concentration among Nashonuma participants. It also showed lower adverse birth outcomes, including low birth weight reduced by 6%, preterm births by 11%, and small vulnerable newborns by 7%. For child health outcomes, stunting at 6 months was 22% lower among Nashonuma beneficiaries (equivalent to 9.4 percentage-points), especially reflecting improved maternal nutrition, and at 12 months, it was 18% lower (equivalent to 10.1 percentage-points). The evaluation also found reduced child anemia by 12%, increased full immunization coverage by 17%, while <25% of women achieved adequate dietary diversity.
Launched in 2020, the Benazir Nashonuma Programme targets pregnant and breastfeeding women and children under 2, focusing on the pivotal first 1,000 days. Through its integration with BISP, Nashonuma can reach the most vulnerable mothers and children. The programme is delivered through 578 facilitation and 169 stabilization centers and has reached 4.6 million women and children so far.
Nashonuma provides a comprehensive package of nutrition-specific and -sensitive interventions:
Antenatal and postnatal care services, child growth monitoring and immunization.
Awareness sessions, Social Behavior Change to foster positive maternal, infant and young child nutrition, health, hygiene, breastfeeding and complementary feeding practices.
Conditional cash stipends provided by BISP.
Provision of specialized nutritious food (SNF) and Multi-Micronutrient Supplements (MMS) for mothers and children. SNF consists of 75 and-50 grams of nutrient-packed paste to complement the diet by filling nutrient gaps.
Screening and Management of Moderate and Severe Acute Malnutrition for children and mothers, including lifesaving treatment.
The Nashonuma Programme is managed by the Government of Pakistan under BISP. The World Food Programme (WFP), in close partnerships with Health Departments, supports the management of the 578 Facilitation Centers and the procurement and distribution of SNF to prevent stunting. The centres also screen for, and manage, acutely malnourished children and women. Severe cases with medical complications are referred to one of the 169 nutrition Stabilization Centres supported by the World Health Organization (WHO), which provide lifesaving medical treatment and therapeutic milk (F-75 and F-100), as well as Ready-to-Use Therapeutic Food (RUTF). UNICEF provides RUTF for the treatment of severe acute malnutrition, MMS for women’s micronutrient deficiencies, and manages Social Behavior Change Communication & community engagement.